Insights
The Insights page turns the authorization decisions flowing through your workspace into a set of visualizations, giving you an at-a-glance picture of what Cerbos is doing in production. Where the audit log lets you inspect individual decisions, Insights aggregates those same decisions into charts and rankings so you can spot trends, surface anomalies, and understand which principals and resources are driving authorization traffic.
The visualizations are built entirely from the decision data your PDPs already send to Cerbos Hub — there is nothing extra to configure. Once audit log collection is enabled and decisions start arriving, the Insights page populates automatically.
|
Insights is only available to workspace members who can view audit logs. The page draws on the same decision data as the audit log, so access follows the same rules: it is visible to users with the Owner or Analyst role (see User management), and only once audit log collection has been enabled for the workspace. Members without audit log access will not see the Insights tab in the workspace navigation. |
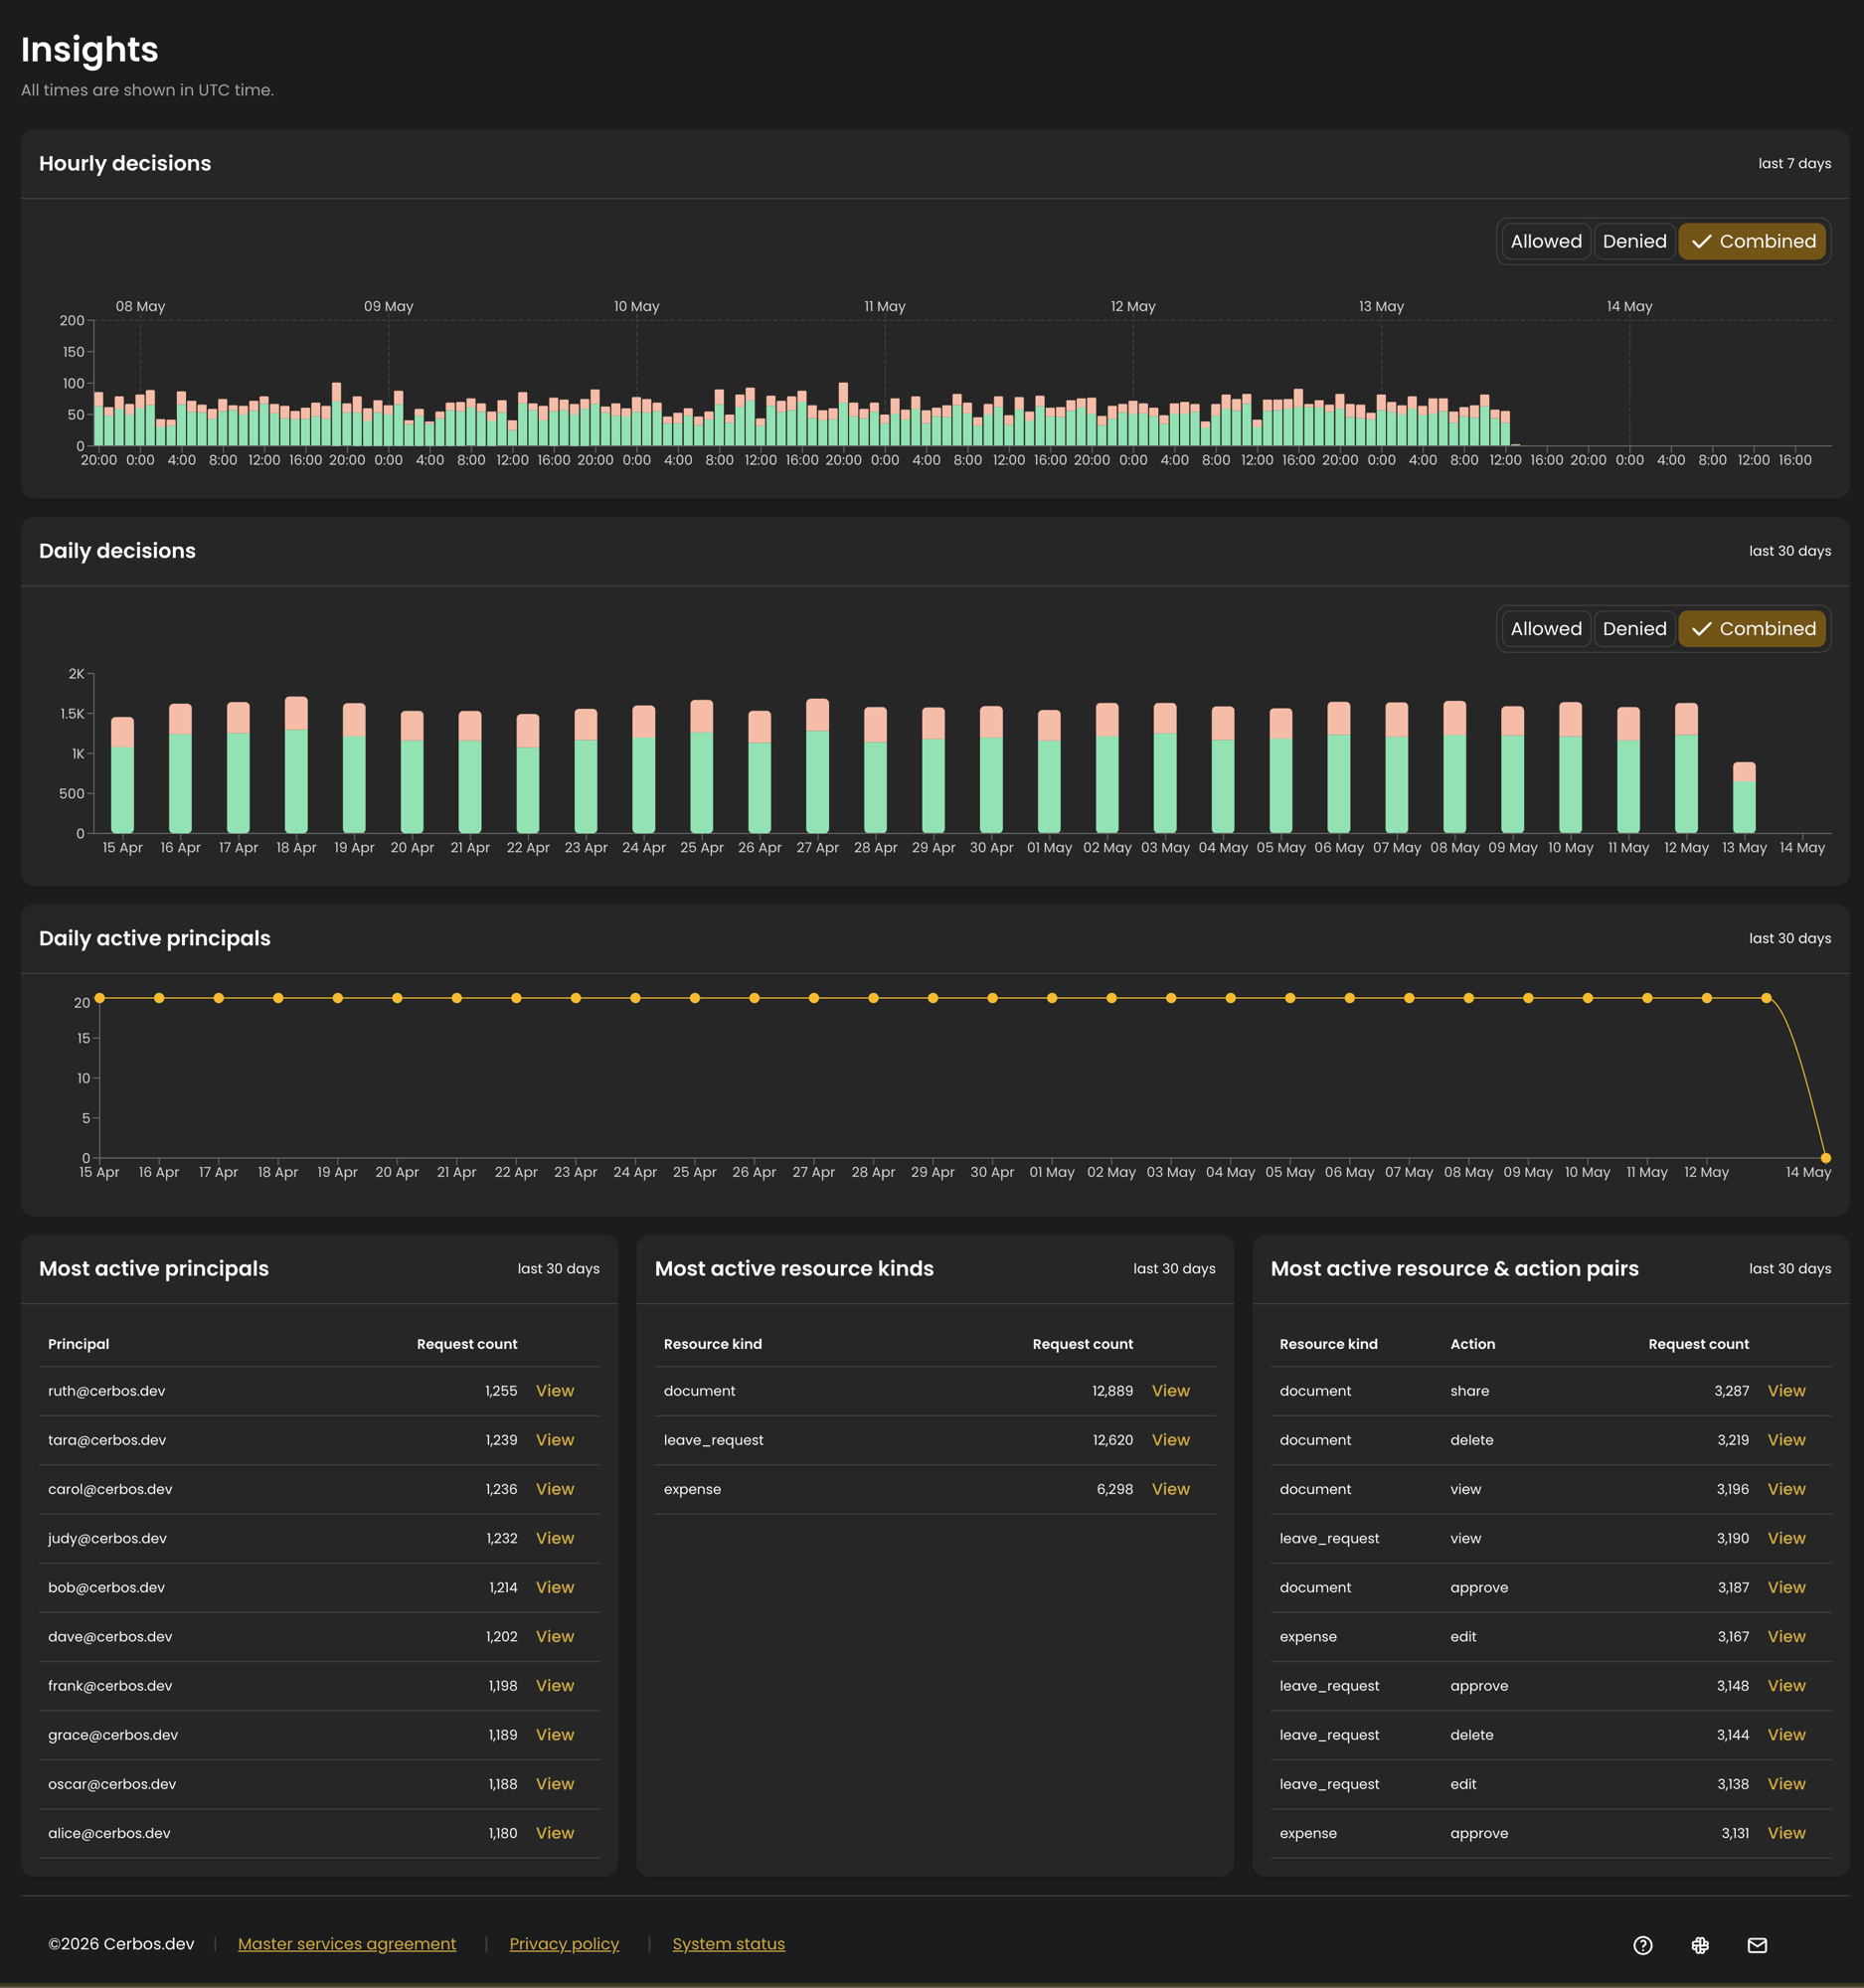
All times on the page are shown in UTC.
Why it matters
A table of raw audit logs answers the question "what happened in this specific request?". Insights answers the broader questions that matter when you are operating an authorization service:
-
Is Cerbos working? Live charts of allows and denies make it immediately obvious that decisions are flowing and policies are being enforced.
-
What changed? A sudden swing in the ratio of denies to allows can point to a stricter-than-intended policy change, a misconfigured client, or an application bug such as a typo in a resource or action name.
-
Who and what is driving traffic? Rankings of the busiest principals and resources help you understand adoption, plan for capacity, and notice unexpected usage patterns.
This makes Insights useful both for day-to-day operational monitoring and for demonstrating, at a glance, that your authorization layer is healthy.
Decision activity charts
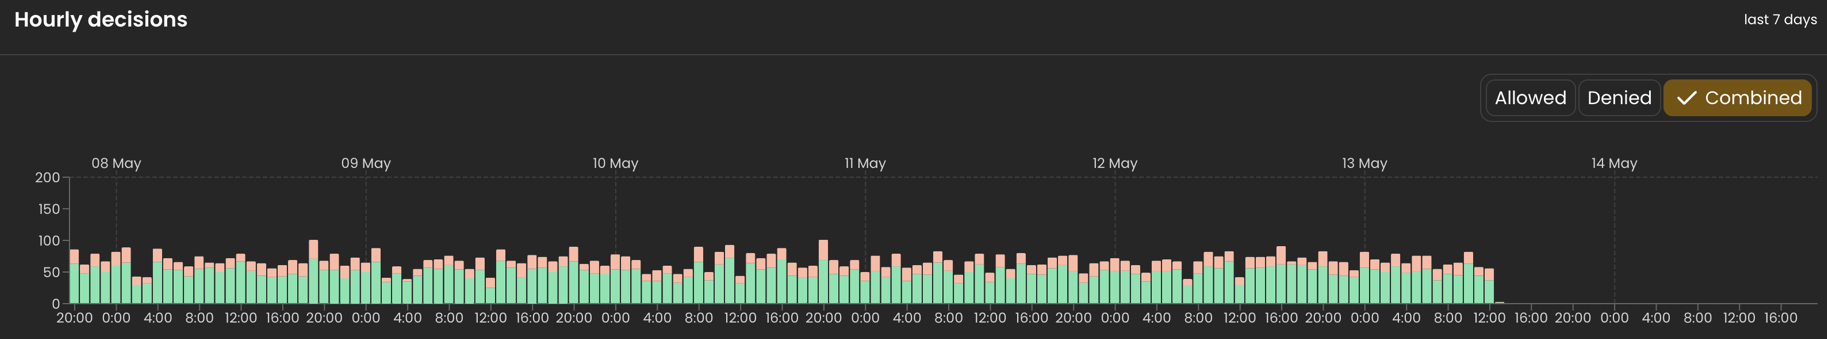
Hourly decisions
A stacked bar chart of allowed and denied decisions per hour over the last 7 days, with allows and denies shown as separate colours in each bar. The fine-grained, hourly view is best for spotting short-lived spikes and anomalies, for example a burst of denials following a deployment.
Use the toggle in the top right of the chart to switch between Allowed, Denied, and a Combined view that shows both.
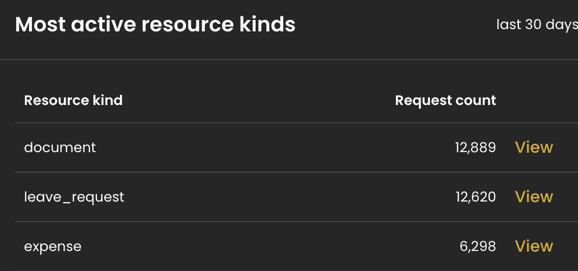
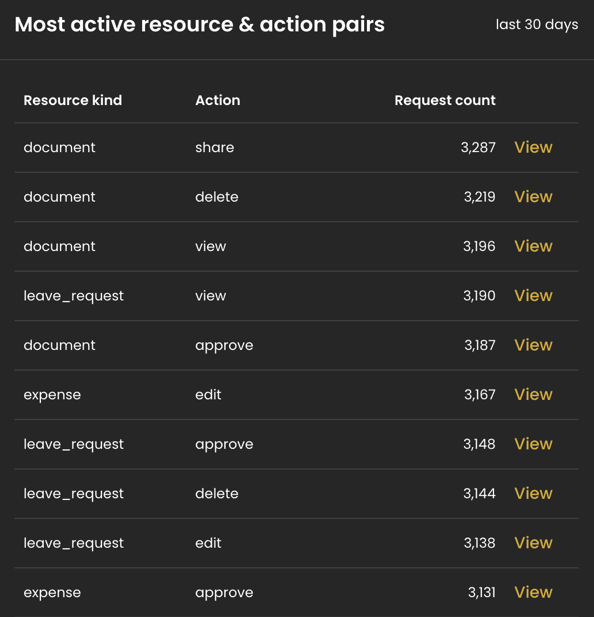
Activity rankings
Three tables rank the busiest entities in your workspace over the last 30 days, each ordered by request count. Every row has a View link that opens the audit log filtered to that entity, so you can go straight from a ranking to the decisions behind it.
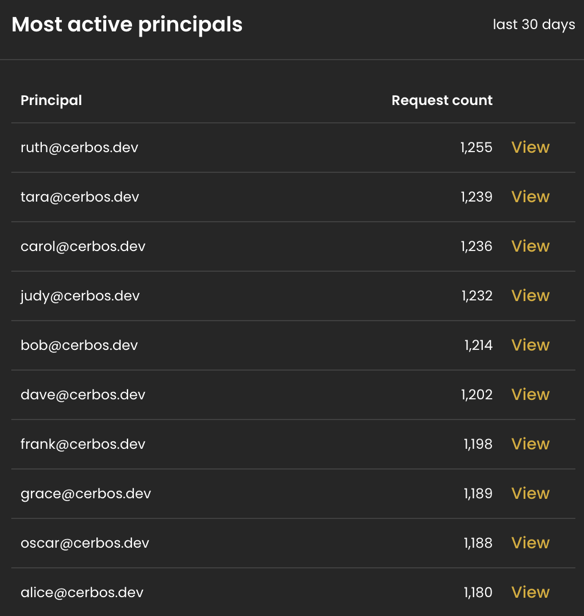
Most active principals
The top principals by request volume, showing the principal ID and its total request count. Useful for identifying your heaviest consumers and for catching a single principal generating an unexpected amount of traffic.
Drilling into the detail
The activity tables link through to the audit log via the View link on each row, pre-filtered to match the principal, resource kind, or resource-and-action pair you selected. When a ranking surfaces something worth investigating, such as an unusually busy principal, you can jump straight from the aggregated view into the underlying decisions without rebuilding the filter by hand.