Audit log collection
With a simple configuration change, you can configure your PDPs to securely send audit logs to Cerbos Hub. This vastly simplifies the work that would otherwise be required to configure and deploy a log aggregation solution to securely collect, store and query audit logs from across your fleet.
For embedded PDPs, decision logs can be captured locally using the SDK’s onDecision callback. See ePDP SDK options for details.
Enabling collection
Open the deployment and select the Client credentials tab. Click Generate a client credential and generate a Read & write credential. Save the client secret in a safe place as it cannot be recovered.
The client credentials can be provided to the PDP using environment variables or the configuration file. The environment variables to set are:
CERBOS_HUB_CLIENT_ID
|
Client ID |
CERBOS_HUB_CLIENT_SECRET
|
Client secret |
CERBOS_HUB_PDP_ID
|
Optional. A unique name for the PDP. If not provided, a random value is used. |
CERBOS_HUB_WORKSPACE_ID
|
ID of the workspace that receives the audit logs. Equivalent to |
Alternatively, you can define these values in the Cerbos configuration file as follows:
hub:
  credentials:
    pdpID: "..." # Optional. Identifier for this Cerbos instance.
    clientID: "..." # ClientID
    clientSecret: "..." # ClientSecret
To enable audit log collection, configure the hub audit log backend with a local storage path. This local storage path is important for preserving the audit logs until they are safely saved to Cerbos Hub. If there are any network interruptions or if the PDP process crashes, the audit logs generated up to that point are saved on disk and will be sent to Cerbos Hub the next time the PDP starts. If you’re using a container orchestrator or a cloud-based solution to deploy Cerbos, attach a persistent storage volume at this path to ensure that the data does not get lost.
Set audit.hub.workspaceID to the ID of the workspace that receives the audit logs. The PDP configuration examples in Cerbos Hub include this value. The setting requires Cerbos PDP v0.56 or later. If it is not set, the PDP sends audit logs to the deployment named by the CERBOS_HUB_DEPLOYMENT_ID environment variable. If neither is set, the logs go to the workspace that owns the client credential, and the PDP logs a deprecation warning at startup.
Cerbos Hub rejects audit logs sent to a workspace or deployment that the client credential is not permitted to write to. Use a Read & write credential from the same workspace as the target.
server:
  httpListenAddr: ":3592" # The port the HTTP server will listen on
  grpcListenAddr: ":3593" # The port the gRPC server will listen on

hub:
  credentials:
    pdpID: "..." # Optional. Identifier for this Cerbos instance.
    clientID: "..." # ClientID
    clientSecret: "..." # ClientSecret

audit:
  enabled: true
  backend: hub
  hub:
    workspaceID: "..." # Workspace ID to send audit logs to. Requires PDP v0.56 or later.
    storagePath: "..." # Local storage path for buffering the audit logs.
Refer to Cerbos documentation for details about common audit configurations that apply to all backends. You can configure an optional secondary output for the audit logs. This is useful for cases where you want to aggregate Cerbos audit logs into an existing silo for compliance and monitoring purposes while still taking advantage of the powerful features provided by Cerbos Hub to view and analyze log entries.
The following snippet demonstrates how to configure a secondary output that writes audit entries to standard output of the container.
audit:
  enabled: true
  backend: hub
  hub:
    workspaceID: "..." # Workspace ID to send audit logs to. Requires PDP v0.56 or later.
    storagePath: "..." # Local storage path for buffering the audit logs.
    pipeOutput: # Secondary output configuration
      enabled: true
      backend: file # Any supported audit backend can be used here.
  file: # Configuration for the file backend which is used by the pipeOutput configuration above.
path: stdout|
To quickly try out the Cerbos Hub audit logs feature, you can use the following command. |
Accessing the logs
Once collection is enabled, the logs can accessed via the Audit logs tab in Cerbos Hub. From here you can select which logs to view:
Decision logs
The decision logs are records of the authorization decisions made by the Cerbos PDP. These logs provide detailed information about each decision, including the inputs, Cerbos policies evaluated, and the ALLOW/DENY decisions along with any outputs from rule evaluation. Besides providing a comprehensive audit trail, these records can be used for troubleshooting purposes and to understand how Cerbos policies are used within your organization.
The log list displays each entry with the timestamp, call ID, request kind (CheckResources or PlanResources), principal ID, resource kind, resource ID, and action decision. Toggle between the Decision view for a compact summary or JSON view for raw log data.
Log entry details
Click on any log entry to open the details panel, which shows:
-
Principal: The user or service that made the request, including their ID, roles, effective derived roles, and any attributes.
-
Resource: The resource being accessed, including kind, ID, scope, and attributes.
-
Decisions: The authorization outcome for each action, showing the effect (
ALLOWorDENY) and which policy produced the decision. -
Outputs: Any output values returned by policy rules.
-
Raw JSON: The complete log entry in JSON format.
Deep linking to policies
Policy names in audit log entries are clickable links. Click any policy name in the Decisions section to navigate directly to that policy in your policy store. This makes it easy to investigate authorization decisions and understand the policy logic behind each outcome without manually searching for the relevant policy file.
Access logs
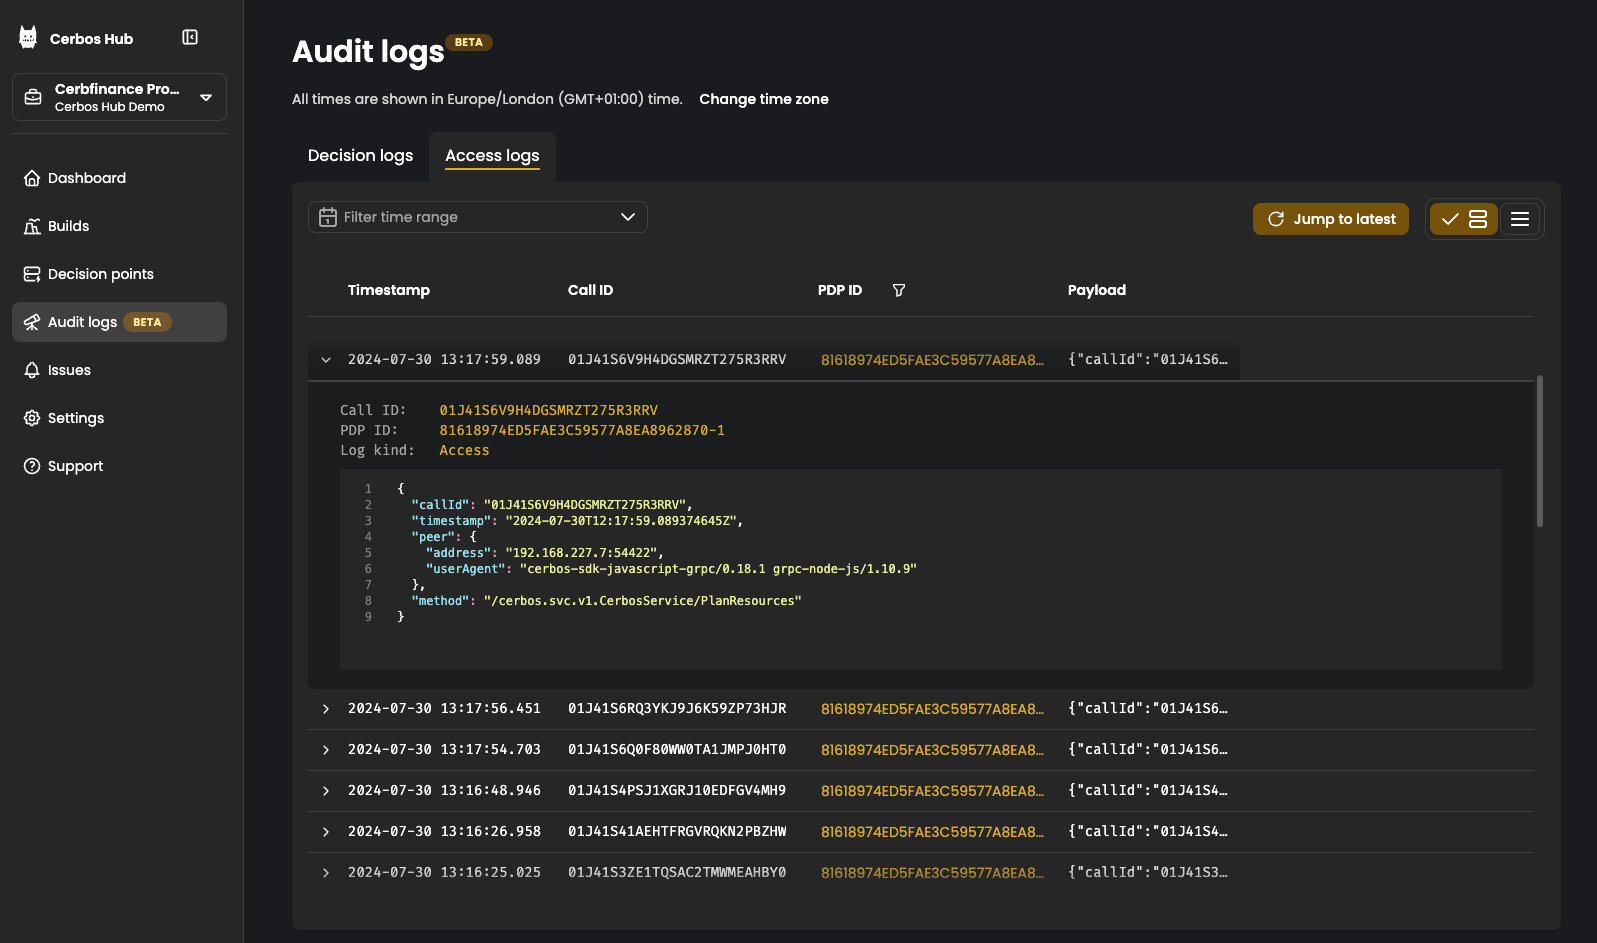
The access logs are records of all the API requests received by the Cerbos PDP. The valid CheckResources and PlanResources API calls would have a corresponding decision log entry with the the same call ID. API requests that are invalid or unauthenticated are logged as well and can be used for identifying misconfigured clients or unauthorized access attempts.
You can filter the logs by a particular PDP and a time range.
Exporting logs
Decision and access logs can be exported from Cerbos Hub as files, for long-term archiving or for analysis in your own tooling. Exports are encrypted before they leave Cerbos Hub, so only you can read them.
Exporting requires the Owner or Analyst role in the workspace or the organization. See User management for the full permissions matrix. Exports are not available for on-premises deployments, where the audit log data already resides in your own infrastructure.
|
Starting an export
Apply the filters and time range you want on the Decision logs or Access logs tab, then click Export. The export dialog shows the filters that will be applied, so you can confirm you are exporting the entries you were looking at, and lets you adjust the time range before confirming. If you have not selected a time range, the export defaults to the last 24 hours.
Exports are produced in the background. Click Add to export queue to start one, then follow its progress on the Exports tab. You do not need to keep the page open.
| Cerbos Hub limits how many exports can be started from a workspace within an hour. When the limit is reached, starting another export fails and nothing is added to the queue. An export stops counting towards the limit an hour after it was created. |
Encryption keys
Every export is encrypted with age before it is written to storage. You need the corresponding secret key to read the file afterwards.
-
If you already have an age key pair, paste the public portion (it begins with
age1) into the Public encryption key field when starting the export. -
If you leave the field blank, Cerbos Hub generates a key pair for you and displays it once, immediately after the export is queued. Copy both parts, or click Download key pair to save them as an
age.keyfile in the format theagetools expect.
| Cerbos Hub does not retain the secret key, and it cannot be recovered or reissued. If you lose it, the export cannot be decrypted and you will need to run a new one. Store it somewhere safe, such as your organization’s secret manager. |
The Exports tab
The Exports tab lists every export requested in the workspace, showing the log type, who requested it, when it was created, when it expires, the public key it was encrypted for, and its status:
-
In progress: the export has been queued or is being generated. The list refreshes automatically while any export is in this state.
-
Ready: the export is complete. Click Download to retrieve the file.
-
Failed: the export could not be completed. Click Retry to reopen the export dialog with the same filters and time range already applied.
-
Expired: the file is past its retention period and is no longer available. Run a new export to obtain the same data.
Expand a row to see the time range and filters the export was created with, the public key used to encrypt it, and the exact command needed to decrypt it.
Downloading and decrypting
The downloaded file is age-encrypted and gzip-compressed, and contains the exported entries as JSON Lines, one JSON object per log entry. To decrypt and read it, save your secret key as age.key and run:
age -d -i age.key <exported-file> | gunzipBecause the output is JSON Lines, it can be piped directly into tools such as jq, or loaded into a data warehouse or SIEM without further conversion.
Retention
Completed exports remain available to download for seven days from the time they were generated. After that, the file is deleted and the export is marked as expired. Expiry applies only to the exported file; the underlying audit log data is unaffected and continues to be retained according to your plan, so the export can be re-created as long as the entries are still within that retention period.
Masking sensitive fields
You can define masks to filter out sensitive or personally identifiable information (PII) that might be included in the audit log entries. Masked fields are removed locally at the PDP and are never transmitted to Cerbos Hub.
Masks are defined using a subset of JSONPath syntax.
Use case-sensitive protobuf JSON field names, such as forwardedFor, for message fields. Map keys, such as principal attributes, must match the keys in the logged data. Paths that do not match a field are silently ignored.
hub:
  credentials:
    pdpID: "..." # Optional. Identifier for this Cerbos instance.
    clientID: "..." # ClientID
    clientSecret: "..." # ClientSecret

audit:
  enabled: true
  backend: hub
  hub:
    workspaceID: "..." # Workspace ID to send audit logs to. Requires PDP v0.56 or later.
    storagePath: "..." # Local storage path for buffering the audit logs.
    mask:
      # Fields to mask from CheckResources requests
      checkResources:
        - inputs[*].principal.attr.foo
        - inputs[*].auxData
        - outputs
      # Fields to mask from the metadata
      metadata:
        - authorization
      # Fields to mask from the peer information
      peer:
        - address
        - forwardedFor
      # Fields to mask from the PlanResources requests.
      planResources:
        - input.principal.attr.nestedMap.foo
Use the local audit backend along with cerbosctl audit commands to inspect your audit logs locally and determine the paths that need to be masked.
|
Masks are applied before each entry is written to the local buffer on disk, so masked fields are neither stored locally nor transmitted to Cerbos Hub. To drop whole metadata keys such as authentication tokens, rather than mask specific field paths, use the top-level includeMetadataKeys and excludeMetadataKeys settings. Refer to Cerbos audit configuration for more details.
|
Data storage
For Cerbos Hub cloud, audit logs are stored in Cerbos-managed infrastructure in the Netherlands (GCP europe-west6). Logs are retained according to your plan’s retention policy.
For on-premises deployments, audit logs are stored in a ClickHouse instance running in your own infrastructure. You control data residency, retention, and access.
Audit log data can be integrated with SIEM and UEBA systems by configuring the secondary pipe output to forward log entries to your existing log aggregation infrastructure.
Advanced configuration
Advanced users can tune the local log retention period and other buffering settings. We generally do not recommend changing the default values unless absolutely necessary.
audit:
  enabled: true
  backend: hub
  hub:
    workspaceID: "..." # Workspace ID to send audit logs to. Requires PDP v0.56 or later.
    storagePath: "..." # Local storage path for buffering the audit logs.
    retentionPeriod: 168h # How long to keep buffered records on disk.
    advanced:
      bufferSize: 16 # Size of the memory buffer. Increasing this will use more memory and the chances of losing data during a crash.
      maxBatchSize: 16 # Write batch size. If your records are small, increasing this will reduce disk IO.
      flushInterval: 30s # Time to keep records in memory before committing.
      gcInterval: 15m # How often the garbage collector runs to remove old entries from the log.